Manual Handling Training

Prevent workplace injuries and improve safety practices.

Actevate delivers practical manual handling and safe lifting training for workplaces, aligned to the Hazardous Manual Tasks Code of Practice. The aim is to prevent musculoskeletal injury before it becomes a claim.

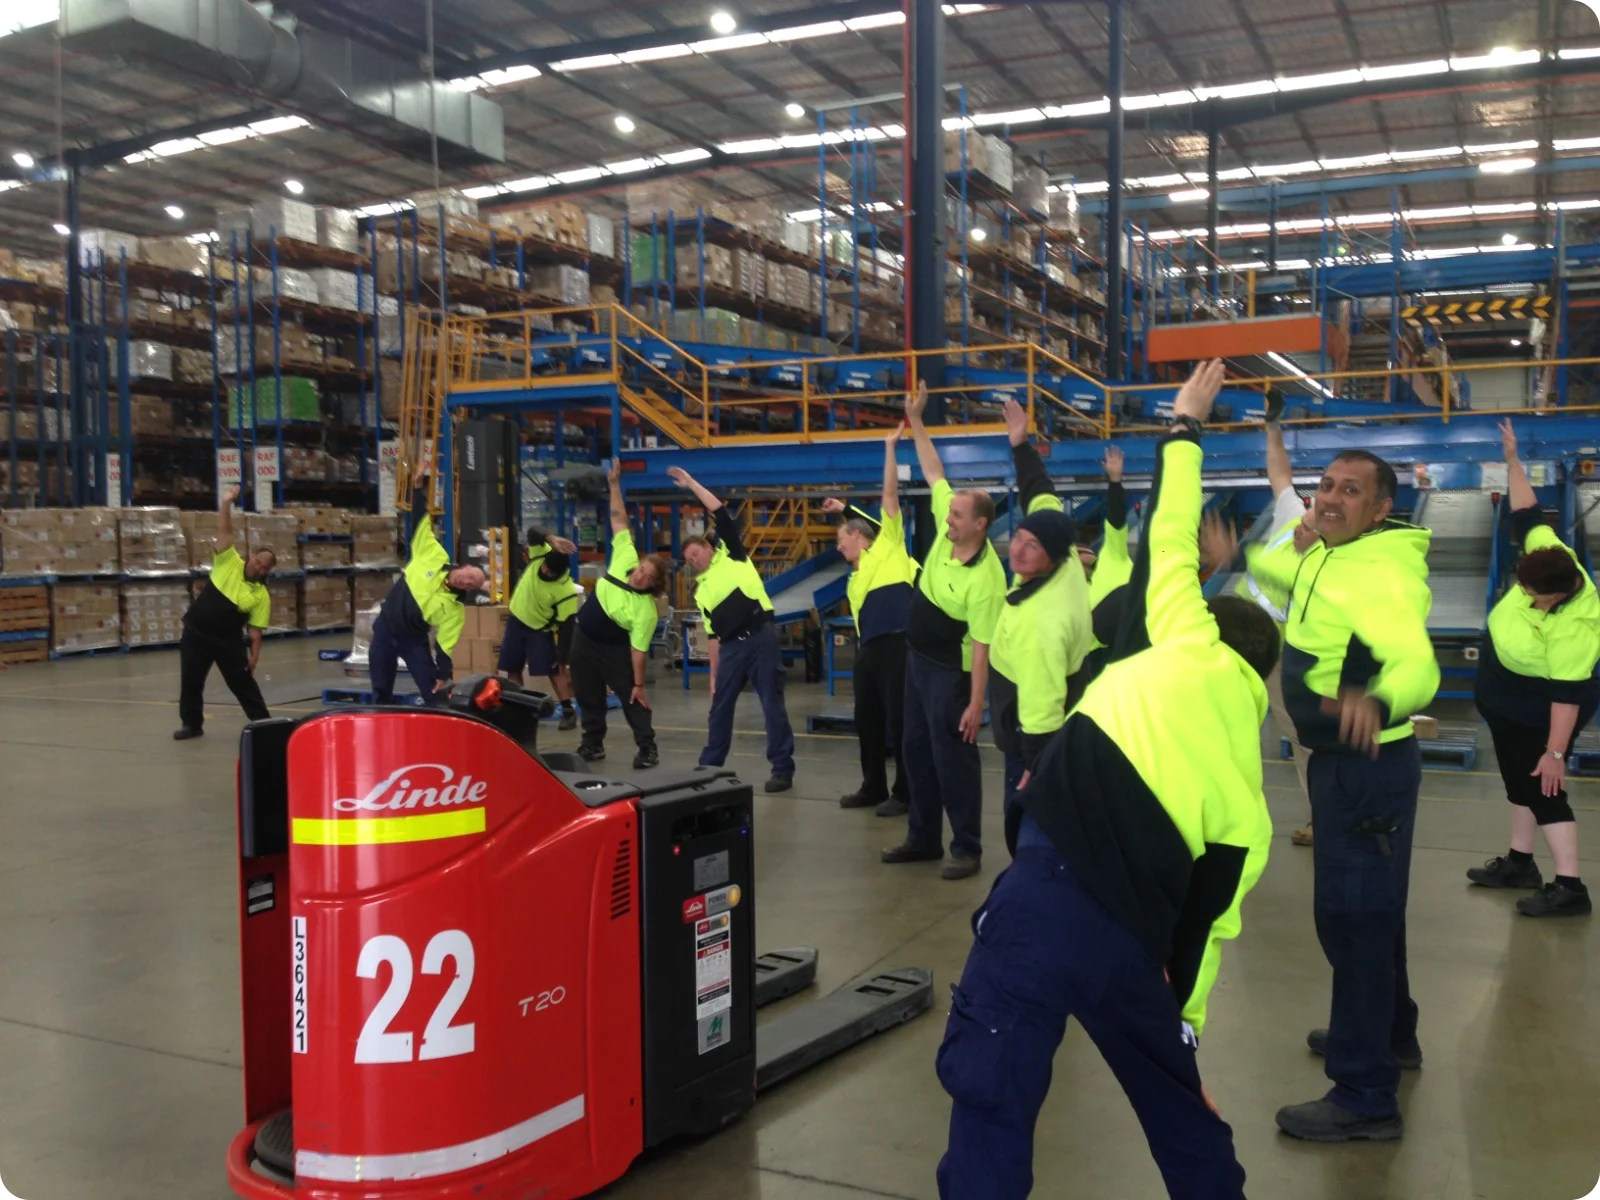
Workers practising safe lifting technique in Actevate manual handling training
Trusted By Leading Companies in Australia
Warehouse worker in high-vis in a logistics facility
Functional capacity assessment of a worker's physical abilities
MANUAL HANDLING TRAINING

The most common workplace injury in Australia is also the most preventable.

One in three serious workers compensation claims starts with a lift, a carry or a strain. Actevate’s manual handling training is built on a task analysis of your actual roles and delivered by physiotherapists, exercise physiologists and occupational therapists who know where risk lives.

Prevent injuries
Regulatory Compliance
Hazard Awareness
Lower expenses
Optimised Equipment Use
Improved Employee Morale
Enhanced Staff Retention
Long-Term Health Protection
WHY IT MATTERS NOW

Body stressing is the #1 cause of serious claims in every single occupation group.

From nurses to managers to drivers, muscular stress from lifting, carrying and handling is the most common way Australians get seriously hurt at work (and one of the few injury mechanisms training can directly reduce).

Speak with us
1 in 3
serious workers compensation claims in Australia are caused by body stressing.
#1
body stressing is the most common cause of serious claims.
7.4 weeks
median time lost for serious joint, ligament, muscle and tendon injuries.
~$16k
average compensation paid per serious musculoskeletal injury claim.
Sources: Safe Work Australia, Key WHS Statistics & mechanism-of-injury analysis.
our approach

We analyse your tasks before we train a single person.

Generic manual handling training fails because it teaches generic lifts. Every workplace is unique, and your environment carries its own manual handling risk profile. Before any session, Actevate undertakes a pre-training task analysis and job description benchmarking of your actual roles, duties and injury history.

The training your team receives is then built around reality of the job with workplace-specific demonstrations aligned to your industry and real-life case studies. Everything runs in accordance with Safe Work Australia’s Hazardous Manual Tasks Code of Practice, supporting your WHS obligations.

And because our trainers are degree-qualified physiotherapists, exercise physiologists and occupational therapists who manage workplace injuries every day, the biomechanics and anatomy your team learns comes from people who deeply understand where hidden risk lives.

FORMATS AND INVESTMENT

Pick the pathway and delivery that suits your needs.

Theory Only

A 60-minute tailored presentation covering ergonomic principles, posture and injury prevention applicable to your worksite. Ideal for inductions and office-based teams.

All
60 minutes
Up to 20 participants
Handouts & certificates
From $495
+ GST per session

Ongoing Injury Prevention Program

Twelve monthly group sessions building strength, lifting technique and wellness across the year. One session changes awareness, but a year changes culture.

All
Progressive program
Up to 30 participants
12 monthly sessions
From $5,200
+ GST per session

All formats include a pre-training task analysis, handouts, stretching cards and certificates of participation. Multi-site and bulk pricing available. Call 1300 663 155.

WHAT YOU WALK AWAY WITH

Actionable outcomes that foster a culture of safety.

Safety, injury prevention and self-care practices with workers owning their part of the responsibility.
Workplace-specific demonstrations aligned to your industry and roles.
Understanding resilience principles and how they relate to safety and manual handling.
Practical knowledge of preventing injuries for themselves and the people they work beside.
A sound understanding of biomechanics and anatomy, taught by clinicians.
Real-life case studies and interactive discussion.
Each person knowing their own safe, maximal lifting and loading limits.
A documented contribution to your Hazardous Manual Tasks Code of Practice compliance.
Icon
Training without workplace context doesn’t change behaviour. Ours is built from your tasks, your roles and your injury history.
FAQ

Frequently Asked Questions

What is manual handling training?

Why is manual handling training important?

Who should attend manual handling training?

Is the training tailored to our industry?

Where is the training delivered?

How long does a session take?

How often should training be refreshed?

How do we book manual handling training for our team?

One session is cheaper than one claim.

Tell us about your site and team, and a specialist will call you back within one business day to scope the task analysis and lock in a date.

Australia & New Zealand
Long-Term Health Protection
Delivered by physios, EPs & OTs
Prefer to talk now? Call 1300 663 155
Step 1
Fill out this form to let us know what you’re looking for.
Step 2
Our team will be in contact to set up a chat within 24 hours.
Thank you. We have received your request. A member of our team will be in touch.
Explore our blog posts
Oops! Something went wrong while submitting the form.
Smiling worker in a hard hat and high-visibility vest, illustrating Australian work health and safety statistics
October 12, 2026
•
5 min
Safe Work Australia releases its Key Work Health and Safety Statistics

The national picture at a glance

Safe Work Australia released its latest Key Work Health and Safety Statistics in October 2025, during National Safe Work Month. The report brings together national data on worker deaths and serious workers compensation claims, and the figures below come from that edition.

  • 188 workers died from traumatic injuries at work in 2024
  • 146,700 serious workers compensation claims in 2023-24
  • 1.3 deaths per 100,000 workers in 2024
  • $16,300 median compensation paid on a serious claim

Source: Safe Work Australia, Key Work Health and Safety Statistics Australia 2025. Median compensation is for 2022-23, the most recent finalised year.

Over the past decade the fatality rate has fallen 24%, from 1.7 to 1.3 deaths per 100,000 workers. That reduction has largely plateaued in recent years, which suggests the controls that drove earlier gains are no longer enough on their own to reduce harm further.

Serious claims tell a different story. There are 37,600 more serious claims each year than a decade ago, an increase of 34.5%. After allowing for growth in the hours Australians work, the frequency rate has risen 12.6% over the same period, to 6.8 serious claims per million hours worked.

Note: A serious claim is a workers compensation claim involving at least one working week off work. The 2023-24 claims data is preliminary and will be revised as claims are finalised, so time lost and compensation figures in this article come from 2022-23, the most recent finalised year.

Fatalities by state and territory

Chart: Worker fatalities by state or territory, 2024

  • Queensland: 53
  • New South Wales: 48
  • Western Australia: 31
  • Victoria: 28
  • South Australia: 17
  • Northern Territory: 4
  • Tasmania: 4
  • Australian Capital Territory: 3

Source: Safe Work Australia, Key Work Health and Safety Statistics Australia 2025, worker fatalities by state and territory.

Queensland recorded the most worker deaths in 2024, followed by New South Wales. Raw counts largely reflect the size of each workforce, so the rate per 100,000 workers is the better measure of relative risk.

Chart: Fatality rate per 100,000 workers by state or territory, 2024

  • Northern Territory: 2.8
  • Western Australia: 1.9
  • Queensland: 1.8
  • South Australia: 1.8
  • Tasmania: 1.4
  • New South Wales: 1.1
  • Australian Capital Territory: 1.1
  • Victoria: 0.7

Source: Safe Work Australia, Key Work Health and Safety Statistics Australia 2025, worker fatalities by state and territory.

On that measure the Northern Territory had the highest fatality rate, followed by Western Australia.

Info: Fatalities are counted in the state or territory where the death occurred, which is not always the jurisdiction whose WHS laws applied to the work.

The industries and jobs carrying the most risk

Chart: Fatality rate per 100,000 workers by industry, 2024

  • Agriculture, forestry and fishing: 13.7
  • Transport, postal and warehousing: 7.4
  • Mining: 3.4
  • Construction: 2.8
  • Electricity, gas, water and waste services: 2.5
  • All industries: 1.3

Source: Safe Work Australia, Key Work Health and Safety Statistics Australia 2025, worker fatalities by industry.

Transport, postal and warehousing recorded the most deaths in 2024 with 54, ahead of agriculture, forestry and fishing with 44 and construction with 37. Agriculture's fatality rate is more than ten times the national rate.

Two industries moved noticeably away from their five-year averages. Mining recorded 10 deaths, 39% above its average, while manufacturing recorded 7, which is 44% below its average.

By occupation, machinery operators and drivers accounted for nearly a third of deaths (61), with a fatality rate of 6.7 per 100,000 workers, more than five times the national rate. Labourers followed with 50 deaths and a rate of 4.0.

How fatal incidents occurred

Chart: Worker fatalities by mechanism of incident, 2024

  • Vehicle incident: 42%
  • Falls from a height: 13%
  • Being hit by moving objects: 9%
  • All other mechanisms (calculated): 36%

Source: Safe Work Australia, Key Work Health and Safety Statistics Australia 2025, worker fatalities by mechanism of incident. The "all other mechanisms" share is Actevate's calculation.

Vehicles remain the single largest factor in fatal incidents at work. At least one vehicle was directly involved in 124 of the 188 deaths, and half of those involved a truck. Most of them (89) were single vehicle incidents rather than collisions between vehicles.

Tip: In this data a vehicle includes far more than cars and trucks. Tractors, loaders, quad bikes, boats and aircraft are all counted, so any workplace with mobile plant is part of this picture.

Age and sex

Chart: Fatality rate per 100,000 workers by age group, 2024

  • Under 25: 0.5
  • 25 to 34: 1.6
  • 35 to 44: 0.7
  • 45 to 54: 0.9
  • 55 to 64: 1.9
  • 65 and over: 4.3

Source: Safe Work Australia, Key Work Health and Safety Statistics Australia 2025, worker fatalities by age group.

Workers aged 65 and over had a fatality rate more than three times the national figure, and workers aged 45 and over accounted for 52% of all deaths. Men accounted for 96% of worker deaths in 2024, with a fatality rate of 2.4 per 100,000 compared with 0.1 for women.

Where serious injuries and illnesses happen

Chart: Serious claims by industry, 2023-24

  • Health care and social assistance: 29,100
  • Construction: 17,600
  • Manufacturing: 14,800
  • Public administration and safety: 13,600
  • Education and training: 11,100
  • Transport, postal and warehousing: 10,400

Source: Safe Work Australia, Key Work Health and Safety Statistics Australia 2025, serious claims by industry (preliminary 2023-24 data).

Health care and social assistance lodged almost one in five serious claims. The four largest industries together accounted for 51.2% of serious claims while making up 36.3% of the jobs covered by workers compensation.

Once hours worked are taken into account, agriculture, forestry and fishing has the highest frequency rate at 10.0 serious claims per million hours, followed by public administration and safety (9.6), manufacturing (9.4), health care and social assistance (9.4), construction (9.3) and transport (9.0). Every one of those is well above the all-industry average of 6.8.

What causes serious claims

Chart: Serious claims by mechanism of incident, 2023-24

  • Body stressing: 34.5%
  • Falls, trips and slips: 21.8%
  • Being hit by moving objects: 16.0%
  • Mental stress: 11.5%
  • All other mechanisms (calculated): 16.2%

Source: Safe Work Australia, Key Work Health and Safety Statistics Australia 2025, serious claims by mechanism of incident. The "all other mechanisms" share is Actevate's calculation.

Body stressing, which includes injuries from lifting, carrying and repetitive movement, is the most common cause of serious claims in every occupation group. Most falls happen on the same level, with falls from a height making up about a quarter of them.

Long claims drive the cost

Claims with more than 13 weeks off work made up 21.9% of all accepted claims in 2022-23, yet they accounted for 74.8% of compensation paid, or $5.4 billion. The median time lost across serious claims has also grown 35.1% in the decade to 2022-23.

Note: Claims data only shows part of the picture. The ABS work-related injuries survey found that just 30.5% of people injured at work received workers compensation, most often because the injury was seen as too minor to claim.

Mental health claims keep rising

  • 17,600 serious claims for mental health conditions in 2023-24
  • 161% increase over the past ten years
  • 35.7 weeks median time lost
  • $67,400 median compensation paid

Source: Safe Work Australia, Key Work Health and Safety Statistics Australia 2025, mental health conditions claims. Time lost and compensation are for 2022-23.

Mental health conditions now account for 12% of all serious claims. Claims rose by 2,300 in a single year, an increase of 14.7%, and no other type of injury or disease has grown as much over the past decade.

Chart: Median weeks off work by type of injury or disease, 2022-23

  • Mental health conditions: 35.7 weeks
  • Musculoskeletal and connective tissue diseases: 12.9 weeks
  • Fractures: 10.0 weeks
  • Traumatic joint, ligament and muscle injury: 7.4 weeks
  • Wounds, lacerations and internal organ damage: 3.6 weeks

Source: Safe Work Australia, Key Work Health and Safety Statistics Australia 2025, serious claims by nature of injury or disease.

A mental health claim typically keeps someone away from work almost five times longer than the median serious claim, and costs more than four times as much in compensation.

Chart: Most common causes of mental stress claims, 2023-24

  • Harassment or workplace bullying: 33.2%
  • Work pressure: 24.2%
  • Exposure to violence and harassment: 15.7%

Source: Safe Work Australia, Key Work Health and Safety Statistics Australia 2025, mental stress serious claims.

Each of those causes is a recognised psychosocial hazard that employers are required to identify and control. Women are more affected, with mental health conditions making up 17.2% of serious claims by women compared with 8.2% for men.

Info: Diseases and conditions, including mental health conditions, made up 33.5% of serious claims in 2023-24, up from 26.1% a decade earlier. The make-up of workplace harm is shifting from sudden injury towards conditions that develop over time.

Injuries are more serious later in working life

Trend: Serious claims per million hours worked by age group, 2023-24

  • Under 25: 6.4
  • 25 to 34: 5.8
  • 35 to 44: 5.8
  • 45 to 54: 7.2
  • 55 to 64: 9.5
  • 65+: 10.0

Source: Safe Work Australia, Key Work Health and Safety Statistics Australia 2025, serious claims by age group.

The serious claim frequency rate is highest among workers aged 55 and over, and both time lost and compensation rise with age. Median time lost grows from 4.0 weeks for workers under 25 to more than 10 weeks for workers aged 55 and over.

ABS survey data suggests mature-age workers are less likely to be injured at work overall, but more likely to be seriously injured when an incident does happen. With Australia's workforce ageing, their share of claims has grown steadily over the past decade.

What the numbers look like in a 200-person workplace

National rates are easier to act on when they are scaled to a workforce you recognise. Safe Work Australia's incidence rate counts the serious claims lodged each year for every 1,000 jobs covered by workers compensation, and across all industries it sits at 10.9. For a business with 200 workers, that works out to about two serious claims a year.

Chart: Expected serious claims a year for a 200-person workforce (calculated)

  • Agriculture, forestry and fishing: 3.8
  • Construction: 3.5
  • Manufacturing: 3.4
  • Public administration and safety: 3.3
  • Transport, postal and warehousing: 3.2
  • Health care and social assistance: 2.7
  • All industries: 2.2
  • Education and training: 1.8
  • Retail trade: 1.5

Source: Actevate calculation from Safe Work Australia's 2023-24 serious claim incidence rates by industry (claims per 1,000 jobs, multiplied by 0.2).

Industry alone can more than double that expectation. On the national rates, a 200-person construction or manufacturing business would expect three to four serious claims a year, compared with about one and a half in retail.

Note: These figures show what is typical for an industry. Your own claims history remains the better guide to your own risk.

The claims that set your costs

Most of those claims will resolve within a few weeks. The ones that shape your costs are the claims that run past 13 weeks, which make up about one in five claims nationally but around three quarters of all compensation paid.

A single mental health claim shows why. At the national median of 35.7 weeks off work and $67,400 in compensation, it costs more than four typical serious claims combined. The first few weeks of any claim are where an employer has the most influence, because early contact and suitable duties are what stop a claim from moving into that long tail.

Why an ageing workforce or mobile plant changes your numbers

Two factors cut across every industry in the data. Workers aged 55 and over lodge serious claims at more than one and a half times the rate of workers aged 25 to 44, and take longer to recover, so an ageing workforce raises the expected cost of every claim. Separately, any site with tractors, loaders, trucks or other mobile plant carries the risk behind two in three worker deaths, whatever industry it sits in.

Tip: Run the same sum on your own numbers. Divide your serious claims last year by your headcount and multiply by 1,000, then compare the result with your industry's incidence rate in the Safe Work Australia report.

How Actevate can help

Actevate supports employers across the whole employee lifecycle. Our pre-employment health assessments match workers to the demands of their role, our return to work services help injured workers recover and return sooner, and our mental health training and Employee Assistance Program help you manage psychosocial risk before it becomes a claim. To talk through what the data means for your workplace, call 1300 663 155 or get in touch.

Sources

Disclaimer

This article is general information only and does not constitute legal or health and safety advice. Figures are drawn from Safe Work Australia's Key Work Health and Safety Statistics Australia 2025, the latest release as at 12 October 2026. Claims data for 2023-24 is preliminary and may be revised. Percentages and figures marked as calculated, and the charts, are Actevate's own analysis and presentation of that data. Safe Work Australia has not reviewed or endorsed this article.

All
October 6, 2026
•
5 min
Safe Work Australia data shows WHS penalties at a record high

2025 at a glance

Safe Work Australia updates its WHS prosecutions dashboard each year, drawing on public reports of criminal prosecutions under WHS laws across every Australian jurisdiction since 1 January 2020. The 2025 figures were released in September 2026, and the three headline numbers below are the ones Safe Work Australia announced.

  • 308 WHS prosecutions in 2025, down from 321 in 2024.
  • $147,985 average financial penalty per prosecution, up 33% on 2024 and the highest annual average recorded.
  • 99% of prosecutions resulted in a financial penalty.

The fall in prosecutions is the first after four consecutive years of increases, which on its own reads as good news. The penalty figures tell a different story, because the average financial penalty is now the highest annual average recorded.

Chart: Most common industry divisions among defendants in 2025

  • Construction: 43%
  • Manufacturing: 20%
  • Mining: 6%
  • All other industries (calculated): 31%

The mix has shifted since last year. In the 2024 data the top three industries were construction, manufacturing, and transport, postal and warehousing. In 2025, mining has taken third place.

Note: Each defendant is recorded separately in the data, so a single incident can appear more than once. Safe Work Australia compiles the figures from publicly available information on regulators' websites.

Year-by-year trends

A small drop in case numbers says very little about your own exposure. The year-by-year figures on Safe Work Australia's dashboard show where enforcement has been heading since 2020. Unless stated otherwise, figures in this section and the next are read from the dashboard as at 6 October 2026.

Prosecution volumes

Trend: Number of prosecutions per year

  • 2020: 203
  • 2021: 273
  • 2022: 285
  • 2023: 309
  • 2024: 321
  • 2025: 308

Prosecutions rose for four consecutive years, from 203 in 2020 to 321 in 2024, an increase of 58%. The 2025 figure of 308 is the first fall in the data. It is 4% lower than the peak and still the third highest year.

Financial penalty rate

Trend: Share of prosecutions that resulted in a financial penalty

  • 2023: 97%
  • 2024: 98%
  • 2025: 99%

Despite the drop in cases, almost every prosecution recorded results in a financial penalty, and the share has edged up each year. These three figures are the ones Safe Work Australia reported in its September 2026 announcement. The dashboard only records prosecutions that resulted in a finding of guilt, so the figures show that a guilty outcome almost always comes with a financial penalty.

Total penalties

Trend: Total financial penalty per year

  • 2020: $26.67M
  • 2021: $27.77M
  • 2022: $32.29M
  • 2023: $40.34M
  • 2024: $34.95M
  • 2025: $44.99M

The total financial penalty for 2025 was $44.99 million. That is the highest annual total in the data and 29% more than in 2024, from 13 fewer prosecutions.

Average penalty

Trend: Average financial penalty per year

  • 2020: $136.76K
  • 2021: $104.02K
  • 2022: $117.86K
  • 2023: $134.9K
  • 2024: $111.65K
  • 2025: $146.54K

Note: The dashboard currently shows a 2025 average of $146.54K, slightly below the $147,985 that Safe Work Australia announced in September 2026 and that is quoted at the top of this article. On the dashboard figures, the 2025 average is about 31% higher than in 2024.

The average has moved up and down from year to year, with dips in 2021 and 2024. The 2025 figure is the first to pass the previous high set in 2020.

Fatal injury level

Trend: Number of prosecutions where the highest injury level was fatal

  • 2020: 42
  • 2021: 50
  • 2022: 46
  • 2023: 46
  • 2024: 50
  • 2025: 53

In 2025, 53 prosecutions were recorded with a highest injury level of fatal, the most in any year of the data. Prosecutions with a highest injury level of none have also grown, from 17% of the total in 2020 to 26% in 2025, after reaching about 30% in 2023 and 2024.

Note: These figures count prosecutions, not deaths. Each defendant is recorded separately, so one incident can appear more than once, and Safe Work Australia says the data should not be relied on to count the worker deaths or injuries prosecuted each year.

Info: Construction and manufacturing have remained the most common industry divisions among defendants since data collection began in 2020. If you operate in either sector, regulators already know where to look.

Six-year view

Combined, the six years of data say a lot about who is prosecuted and why.

  • 1,699 prosecutions recorded from 2020 to 2025.
  • $207M total financial penalty.
  • $125K average financial penalty from 2020 to 2025.

Highest injury level

Chart: Number of prosecutions by highest injury level, 2020 to 2025

  • Serious: 856
  • None: 426
  • Fatal: 287
  • Unknown: 76
  • Minor: 54

One in four of these prosecutions recorded a highest injury level of none. Safe Work Australia uses that label where there was no injury or other direct impact on a worker, for example where an inspection identified a failure but no injury was caused. A further 287 prosecutions, about 17% of the total, recorded a highest injury level of fatal.

Info: As a guide, Safe Work Australia treats an injury as serious where, for example, it requires hospitalisation for more than a day or results in a fracture of a major bone. Half of all recorded prosecutions had a highest injury level of serious.

Plea

Chart: Number of prosecutions by plea, 2020 to 2025

  • Guilty: 80.8%
  • Unknown: 17.2%
  • Not guilty (calculated): 2.1%

Four in five defendants pleaded guilty. The recorded share of guilty pleas has fallen from 93% in 2020 to 72% in 2025, but that mostly reflects more pleas being recorded as unknown, which rose from 4% to 27% over the same period. Not guilty pleas have stayed in single figures every year.

Category of main offence

Chart: Number of prosecutions by category of main offence, 2020 to 2025

  • Category 1: recklessly expose a person to risk of death or serious injury/illness: 39
  • Category 2: fail to comply exposes a person to risk of death or serious injury/illness: 730
  • Category 3: fail to comply: 52
  • Not applicable: 871
  • Unknown: 7

Very few offences sat at the most serious level. Only 39 prosecutions were Category 1 offences, where a duty holder recklessly or with gross negligence exposes a person to a risk of death or serious injury or illness. Ten of those were in 2025, the most in any year and double the number in 2024.

Where a category is recorded, about 95% of prosecutions were Category 2 or Category 3 offences, which involve a failure to comply with a health and safety duty, and Category 1 offences made up about 5%. Another 871 prosecutions are recorded as not applicable, which Safe Work Australia uses for jurisdictions that had not implemented the model WHS laws in the year of prosecution.

Industry of defendant

Construction has recorded the most prosecutions in every year of the data, with manufacturing second each time. Across the full six years, the dashboard lists transport, postal and warehousing third, ahead of electricity, gas, water and waste services and then agriculture, forestry and fishing.

Note: The dashboard only records prosecutions that resulted in a finding of guilt, and it relies on what each regulator publishes. Safe Work Australia cautions that the data is limited by what is publicly available and should not be relied on for research or other purposes.

Limits of the data

The figures in this article are totals across all WHS offences, and they are not split by the type of hazard involved. The industries that dominate the 2025 numbers are also the traditional settings for physical injury, so it would be a mistake to read the data as proof that psychosocial enforcement is either surging or absent.

What the numbers do show is the direction of enforcement, with a financial penalty in almost every case and a record average in 2025.

Psychosocial risk outlook

The link to psychosocial risk comes from timing. Codes of practice have been legally binding in NSW since 1 July 2026, including the Managing Psychosocial Hazards at Work Code of Practice, so employers are now expected to show how they identify, assess, control and review psychosocial hazards on an ongoing basis.

At the same time, a tool many organisations leaned on has been switched off. People at Work, the free psychosocial risk assessment survey funded by Australian WHS regulators and used by more than 160,000 workers since 2020, closed to users on 2 October 2026.

Note: An organisation-wide survey score was never the whole picture. Psychosocial pressure tends to build in particular teams and under particular leaders, so the evidence that counts shows where a hazard sits and what was done about it.

Implications for officers and boards

Under WHS laws, officers have a personal duty to exercise due diligence. That duty is about more than receiving reports. It asks officers to understand the risks in their business and to verify that the controls for those risks are being used.

That distinction is important in a prosecution. A documented procedure shows what was meant to happen, while the evidence a court looks for is what happened on the day.

An average penalty of $147,985 that grew by about a third in a single year is also an enterprise risk. That puts WHS in front of the board and the audit committee, and it can no longer sit only with the people and culture team.

Questions worth asking at your next leadership meeting include:

  • Which of our risks could kill or seriously injure someone, and who owns each one?
  • When did we last check that the controls for those risks were working on site, and not only written down?
  • Do our board or executive reports show control effectiveness, or only incident counts?
  • How do concerns raised by workers and contractors reach the people who can act on them?
  • Can we name our psychosocial hazards in the terms the Code uses, such as high job demands and low job control?
  • Do we know which teams those hazards are concentrated in, beyond the organisation-wide average?
  • Could we show a regulator a record of identifying, controlling and reviewing each one?

Tip: SafeWork NSW has published a free officer due diligence self-assessment tool. It is a quick way to see which records a regulator would expect your leadership team to produce.

Recommended next step

October is National Safe Work Month, which makes it a natural time to put this data in front of your leadership team. Pick one critical risk, trace it from the risk register to the worksite, and see whether the control you rely on is in place and understood by the people doing the work.

That single exercise will tell you more about your due diligence position than a year of lagging indicators.

How Actevate can help

Actevate helps organisations manage risk across the entire employee lifecycle, from pre-employment through to injury management and return to work. If the data has raised questions about your own systems, call 1300 663 155 or get in touch.

Sources

Disclaimer

This article is general information only and does not constitute legal or health and safety advice. The data is sourced from Safe Work Australia's WHS prosecutions dashboard and related publications, as available on 6 October 2026. Safe Work Australia revises the data each year, so figures may change after publication. Percentages marked as calculated, year-on-year comparisons and the charts are Actevate's own analysis and presentation of that data. Safe Work Australia has not reviewed or endorsed this article. Please refer to the original sources before relying on any figure.
All
National Safe Work Month logo on a green background
October 6, 2026
•
5 min
National Safe Work Month 2026

Safe Work Australia describes this year's theme as a reflection of the fundamental purpose of WHS, which is to prevent work-related death, injury and illness. It also recognises the long-term impact that workplace harm can have on workers, their families, businesses and broader communities.

Put plainly, work should never cost someone their health or their ability to live fully outside of work.

The scale of workplace harm in Australia

  • 188 workers died from traumatic injuries at work in 2024.
  • 146,700 serious workers compensation claims were made in 2023-24.
  • More than 400 serious claims are made every day across Australia.

Note: A serious claim is one where a worker needs at least one working week away from work. Behind each of those 146,700 claims is a person whose recovery, income and family life were disrupted.

The campaign is built around four focus areas

Each week of October has its own focus area, which you can use to shape one conversation with your team at a time.

Week 1 (1-11 October): For life, why WHS matters

Safe Work Australia is encouraging workplaces to reconnect with the purpose behind WHS and the role everyone plays in creating safe and healthy work. This week also includes World Mental Health Day on 10 October.

Week 2 (12-18 October): For health, what WHS protects

Safe Work Australia describes the purpose of work health and safety as protecting workers' lives, health and future, and its activity kit notes that safe work protects both physical and psychological health.

Week 3 (19-25 October): For the future, the long-term impact

Safe Work Australia says the theme is about designing work that prevents injury, illness and long-term harm that can affect every part of life, at work, at home and well into the future.

Week 4 (26-31 October): For all, action across all workplaces

Safe Work Australia says the four focus areas together are meant to help workplaces explore why WHS matters, what it protects and the practical action needed to support safe and healthy work.

Info: World Mental Health Day falls on Saturday 10 October, during Safe Work Month. It is a natural moment to talk about psychosocial hazards such as workload, conflict and exposure to distressing events.

How to take part in your workplace

Safe Work Australia has published two free resources. The campaign kit includes posters, digital displays and social media tiles. The activity kit has weekly activities and discussion prompts designed to turn conversations about safety into action.

A few simple ways to get involved:

  • Choose one activity from the kit for your next team meeting or toolbox talk.
  • Ask your team which hazard they would most like to see looked at more closely this month.
  • Record one commitment as a group, and report back on it before the end of October.
  • Invite a senior leader to join a site walk and listen to what workers raise.

Tip: One conversation that leads to a visible change will do more for your safety culture than a month of posters. Workers do notice when something they raised is acted on.

Building this into your culture of care

The point of a theme like Safe work is for life is that it does not end on 31 October. The Australian Work Health and Safety Strategy 2023-2033 sets a national vision of safe and healthy work for all, and that vision is reached through ordinary decisions about how work is planned and carried out, far more than through awareness campaigns.

Tip: A useful test is to ask what your workplace will still be doing differently in February because of a conversation that started this month. If the honest answer is nothing, the conversation is not finished yet.

Sources

This article is general information only and does not constitute legal or health and safety advice.

All
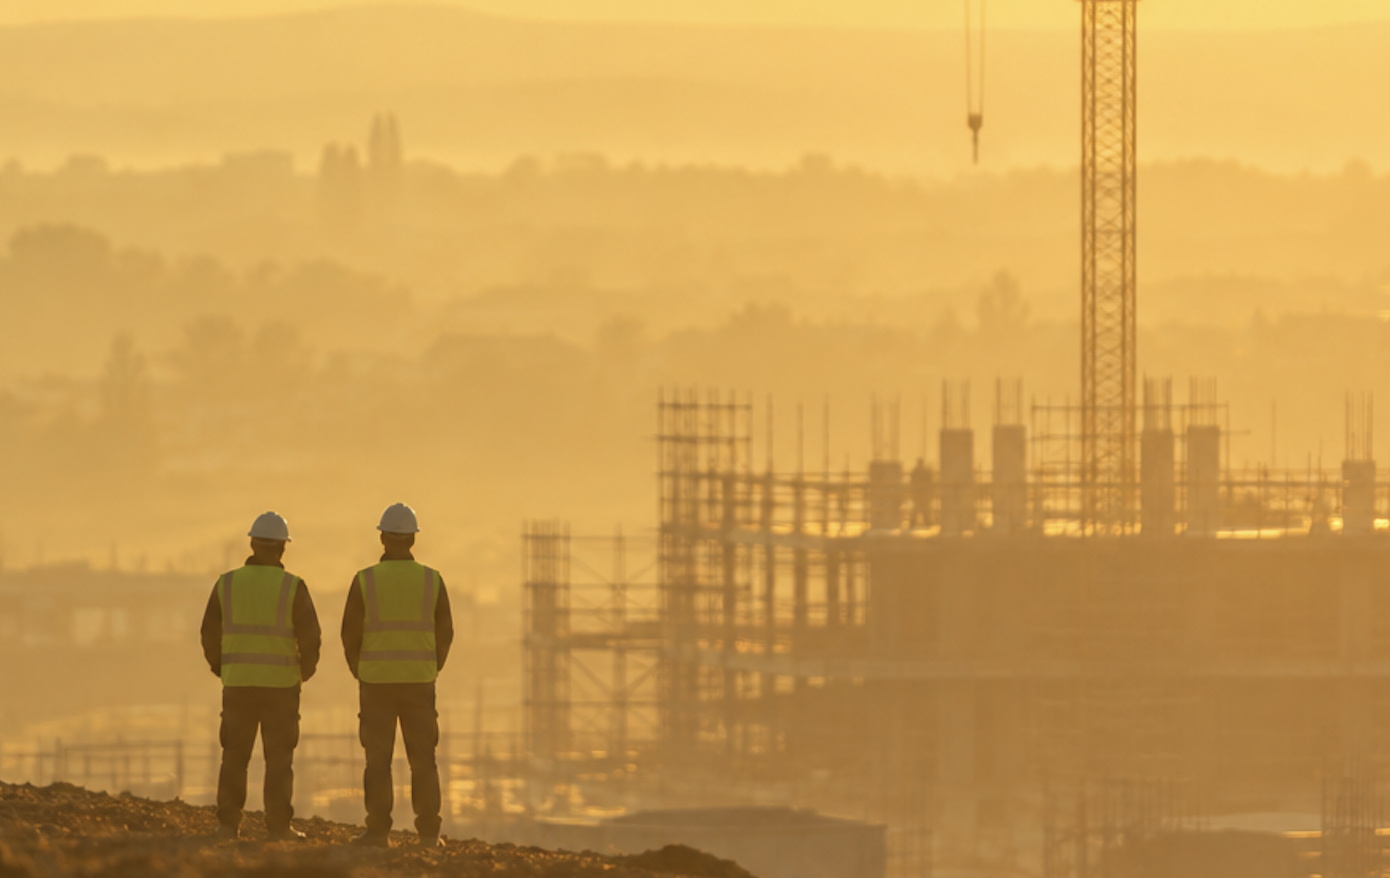
Two workers in high-visibility vests and hard hats overlooking a construction site at sunrise
October 6, 2026
•
5 min
The expanded NSW commutation pathway

What is a commutation?

A commutation is an agreement between a worker and an insurer. The worker receives a lump sum payment, and in return certain ongoing workers compensation entitlements are settled.

Commutations have long existed in NSW, but the eligibility rules were narrow. The recent reforms open the door wider for a limited period.

Note: Once a commutation is approved and paid, the worker is no longer entitled to workers compensation benefits for that injury. It is a significant decision, which is why the process has several safeguards built in.

What has changed

The Workers Compensation Legislation Amendment Regulation 2026 temporarily expands access to commutations to three additional classes of cases. Each class has its own eligibility requirements, set out in Part 9A of the Workers Compensation Regulation 2016.

A few points apply across the board:

  • The worker and the insurer must agree on the worker's degree of permanent impairment before a commutation can proceed.
  • Commutation is voluntary. A worker elects to pursue it, and can withdraw at any time before approval.
  • An agreement only takes effect once it is approved by the President of the Personal Injury Commission.
  • The existing commutation pathways remain available where their preconditions are met.

Info: Whether a particular claim falls within Class 1, Class 2 or Class 3 is a question for the insurer or the worker's legal adviser. SIRA recommends workers confirm this before submitting an Expression of Interest.

The key dates and timeframes

  • Worker submits an Expression of Interest: by 1 April 2028
  • Employer forwards an Expression of Interest to the insurer: within 3 business days
  • Insurer acknowledges the Expression of Interest: within 10 business days of receiving it
  • Application for approval lodged with the Personal Injury Commission: by 1 April 2029

How the process works

  1. Expression of Interest. The worker completes the approved SIRA form and gives it to the insurer or to the employer.
  2. Independent legal advice. Before entering an agreement, the worker must get independent legal advice about its full legal effect.
  3. Independent financial advice. For Class 1 and Class 2 claims, financial advice is mandatory when the proposed amount exceeds $100,000. The insurer pays up to $2,500 towards the cost.
  4. Commutation agreement. If the worker and insurer agree, they complete the approved SIRA agreement form.
  5. Approval. The agreement goes to the Personal Injury Commission, and only takes effect if the President approves it.

Note: The financial advice requirements do not apply to Class 3 claims, which relate to hearing loss.

What employers need to do

The step most likely to catch an employer out is the simplest one. A worker is allowed to hand their Expression of Interest to you instead of the insurer, and when that happens you have three business days to pass it on.

These steps will help you prepare:

  • Decide who in your business receives these forms, and make sure that person knows about the three-day deadline.
  • Brief your return to work coordinator and anyone who manages injured workers, so a form is recognised when it arrives.
  • Ask your insurer or claims service provider which of your open claims may fall within the new classes.
  • Keep your own advice neutral. The decision belongs to the worker, who must get independent legal advice before agreeing to anything.

Tip: Long-running claims carry a real cost in premiums and in management time. A review of your open NSW claims with your insurer will show you where the expanded pathway could be relevant, well before the 2028 deadline starts to bite.

How Actevate can help

Actevate supports employers with injury management and workers compensation claims, including reviewing open claims and the factors driving your premium. If you would like help working out what the commutation changes mean for your claims, call 1300 663 155 or get in touch.

Sources

This article summarises SIRA guidance current as at October 2026. It is general information only and does not constitute legal advice.

All
Interior of a large manufacturing plant with raised walkways and production lines
October 6, 2026
•
5 min
'Reasonable and necessary' what the new NSW treatment requirement means for employers

What has changed

Treatment and services must now be "reasonable and necessary" for their costs to be compensable. The requirement applies to:

  • Medical and related treatment
  • Hospital treatment
  • Ambulance services
  • Workplace rehabilitation services

According to SIRA's guidance for employers, treatment must now primarily treat the compensable injury, be clinically justified and represent value for money. SIRA says the change is designed to improve consistency in decisions about evidence-based treatment and support.

Info: New rules in Part 4A of the Workers Compensation Regulation 2016 set out how insurers must decide whether a treatment or service is reasonable and necessary. The Workers Compensation Guidelines were also revised from 1 October 2026 to reflect the new requirement.

A subtle change in wording with widespread impact

Under the old wording, "reasonably" qualified "necessary". The new wording sets out two separate requirements, and a treatment request has to meet both of these buckets.

In practice, that gives insurers a firmer basis to ask for clinical justification before approving a request. Treatment that would once have been waved through may now attract questions about how it relates to the work injury and what outcome it is expected to deliver.

Which claims the new requirement applies to

The new requirement applies to treatment or service claims made on or after 1 October 2026. Requests made before that date continue to be assessed under the old "reasonably necessary" wording in certain circumstances, including where treatment was approved before 1 October but has not yet been completed.

Note: The date that matters is when the treatment request was made, and not the date of the injury. A worker with a long-standing claim who asks for new treatment today will have that request assessed under the new requirement.

The change applies to all workers, including exempt workers such as police officers, paramedics and firefighters.

What is now excluded

SIRA's guidance says some treatments and services are expressly excluded from employer liability. These include certain alternative therapies, wellness services and unprescribed massage. Some general health or recreational activities are also excluded unless they are prescribed by a medical practitioner.

What this means for your injured workers

A worker who has been receiving a particular treatment may find that a new request for it is questioned. That can be unsettling, particularly for someone who is already anxious about their recovery.

How the change is explained makes a real difference. A worker who hears about it early from a manager they trust is far less likely to experience a request for more information as a rejection.

Tip: Uncertainty about treatment is one of the more common reasons a claim stalls. A short, early conversation that explains the new requirement and the likely next steps helps keep recovery and return to work on track.

What this means for employers

For most employers, the change will be felt in timing and communication more than in policy. Insurers now have a firmer basis to ask for clinical justification, so approvals may take longer, and return to work coordinators and line managers are likely to field more questions from injured workers. Where treatment is on hold, recovery timeframes and suitable duties plans may need to be revisited. Employers who are well placed for the change tend to have people leaders who understand the new requirement and injured workers who have heard early what to expect. They also keep a close working relationship with their insurer or claims service provider, so a delayed or declined request is followed up, and their return to work program and injury management procedures reflect the current wording.

How Actevate can help

Actevate works alongside employers on injury management and return to work, helping injured workers get the right support early and keeping claims moving. Our return to work consultants can help you explain these changes to your team and review how your claims are managed. Call 1300 663 155 or get in touch.

Sources

This article summarises SIRA guidance current as at October 2026. It is general information only and does not constitute legal advice.

All
October 6, 2026
•
5 min
There is no shortcut to psychosocial safety

As business leaders, we are constantly under pressure to scale efficiencies. With premiums climbing and operational costs rising, finding a way to deliver more for less is a constant corporate priority. I am all too familiar with the relentless demand to protect margins and balance competing financial priorities.

Yet, when this cost-containment directive is applied to workforce mental health, I have watched strategic optimisation degrade into structural and safety compromise.

This compromise usually wears the mask of innovation. This systemic vulnerability is most glaringly apparent in the way organisations procure and deploy Employee Assistance Programs (EAPs). Historically relied upon as a primary corporate mechanism for providing psychological and counselling support, the traditional EAP model has been systematically stripped of its human clinical depth to fit under the umbrella of low-cost digital procurement.

There is no shortcut to psychosocial safety

The corporate landscape is currently flooded with software-first vendors promising universal, frictionless access at a fraction of traditional clinical costs. It sounds like the perfect executive trifecta. But this is a dangerous economic illusion. True psychosocial safety is an upstream operational foundation, not a downstream line item. When leaders treat mental health as a transactional product rather than an integrated risk management strategy, they inadvertently create an environment of systemic neglect, trading sustainable organisational health for short-term budget relief.

This new cohort of digital-only Employee Assistance Programs (EAPs) is an understandably alluring proposition to cost-conscious employers. However, compressing margins on psychological safety is a short-sighted strategy. Substituting high-touch, qualified care with automated interfaces does not mitigate corporate risk. Instead, it merely transfers the financial burden from the benefits ledger to the operating statement. It reappears masquerading as heightened absenteeism, costly turnover, increasing claims, and eroded productivity.

Psychosocial safety is not a passive state, it is an active, legally mandated practice of hazard identification and risk minimisation.

Info:Australian employers are legally required to manage psychosocial risks to workers under work health and safety laws.

The Illusion of "Digital Scale"

The reality is uncompromising.

In the field of safety science, a foundational principle remains true: technology can scale transactions, but it cannot scale clinical accountability. A modern digital tech stack is highly valuable for lowering barriers to entry but this operational throughput must never be conflated with clinical efficacy.

When an employee is at their most vulnerable, isolating them with standalone software completely ignores the critical role of human clinical accountability. Worse, standard EAPs offer no continuity of care. Routinely shifting employees through a rotating door of unvetted, external psychologists who have zero context regarding your business or WHS regulations.

True psychosocial safety requires a dedicated clinical team that integrates directly into your organisation.

Software-first platforms often look impressive on a ledger, boasting massive user bases and low per-employee premiums. However, market research reveals that standalone software delivery models frequently struggle with therapeutic inertia, resulting in single-digit engagement and a failure to move the needle on clinical outcomes.

Info:Approximately 60% of organisations are not evaluating their EAPs and the remaining 40% relying on employee feedback, surveys and feedback from their EAP provider.

Mitigating Your Legal and Financial Liability

With Australian employers legally mandated to manage psychosocial hazards under strict Work Health and Safety (WHS) laws, a passive, low-utilisation software platform is no longer a defensible strategy.

The financial and operational value of an integrated model is clearly reflected in our own data. We analysed 500 clinical sessions over the past two years to quantify the direct impact of embedded care. In over 35 per cent of cases, our team of dedicated psychologists and mental health practitioners demonstrably prevented escalation to a time-loss event. By providing immediate, culturally contextualised clinical intervention, we intercepted complex psychological risks that intervened before escalating into a claim.

Fixing the Root Cause

Efficiency is a virtue in business, but human psychology does not heal through algorithmic triage, nor does it thrive under transactional, detached counseling models. When a team member is experiencing distress, they require an integrated care ecosystem and a team of clinicians who know your business, understand your operational hazards, and can step in to resolve systemic issues at the root.

When an EAP operates as a detached software vendor or in a silo, it can only ever react to the symptoms of an individual worker in crisis. It completely lacks the institutional visibility to ask why the crisis occurred. True organisational health requires a continuous feedback loop between clinical intervention and operational design.

In an integrated, embedded model, your clinical team doesn't just hold space for individual recovery; they act as an early-warning diagnostic tool for the entire enterprise. Because these practitioners understand the unique cultural and operational fabric of your business, they can spot macro-trends of distress as they emerge across specific cohorts or leadership branches. This allows the clinical team to securely, compliantly, and proactively consult with your executive leadership.

Instead of just offering individual coping strategies, we help you re-engineer your workflows, communication structures, and cultural hazards that are driving your risk profile in the first place.

Why It Is Time to Rethink Your EAP Partner

In an era of rising premiums, tightening operational margins, and uncompromising legislative scrutiny under Australian WHS laws, business leaders cannot afford the hidden liabilities of superficial care. Squeezing costs on your EAP does not save money. It simply defers the expense, forcing your operating statement to absorb the heavy price of prolonged absenteeism, avoidable worker's compensation claims, and higher employee turnover.

This is exactly why we built our integrated EAP model. We rejected the superficiality of standalone apps and the clinical disconnect of legacy software. Our battle tested delivery model provides your people with instantaneous access to qualified support. We embed a dedicated team of highly qualified practitioners directly into the fabric of your organisation. We secure your people and protect your operational continuity from the inside out.

The choice for modern leadership is clear. Deploying an integrated safety net that actively de-risks your enterprise is the smart safety and strategic choice.

It is time to look past the alluring promises of low-cost digital scale and reinvest in what actually protects your bottom line.

All